Many events impacted global markets in the third quarter of the year, adding to an already complex investment environment. We are highlighting what has been going on the equity and bond markets worldwide and implications for investment portfolios.
Please feel welcome to contact the office for a fall or winter or spring review meeting in person or on video.
–Kurt, Gerdi & our team of twelve professionals.
Global Stock Markets: Summary & Strategy
From the desk of Kurt Rosentreter, CPA, CA, CFP®, CLU, TEP, FMA, CIM®, FCSI
Senior Financial Advisor & Senior Portfolio Manager, Manulife Wealth Inc.
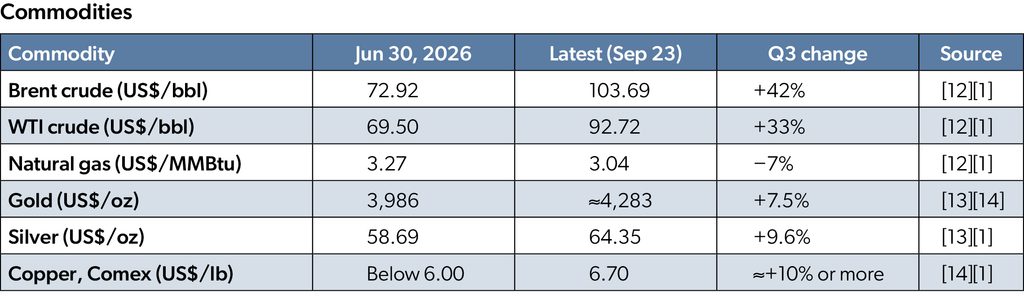
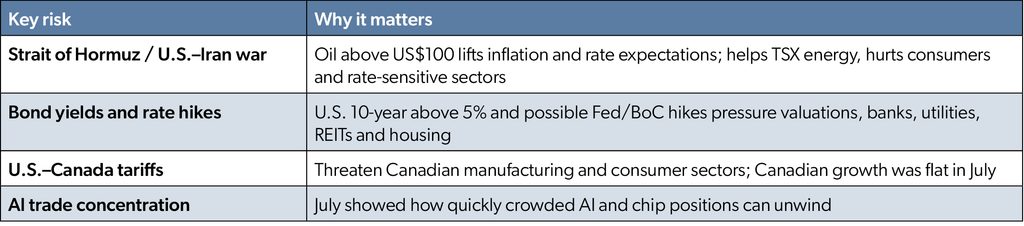
Third quarter 2026 has been shaped by a renewed oil shock from the U.S.–Iran war and the Strait of Hormuz, a return to central-bank tightening, and a sharp July unwind of the AI and semiconductor trade. North American equities are still modestly higher: the S&P 500 is up about 3.4% and the S&P/TSX Composite about 2.6% quarter-to-date, after the TSX set a record of 37,069 in August [1][2][3][4]. The U.S. Fed raised interest rates on September 16 for the first time since 2023, to 3.75%–4.00%, and the U.S. 10-year yield reached about 5.1%, its highest since 2007 [5][4].
For Canada, the quarter brought new 50% U.S. tariffs on about US $20 billion of Canadian goods (August 22), Canadian counter-tariffs (September 8), strong 3.3% annualized Q2 GDP growth, and a Bank of Canada that held the overnight rate at 2.25% but signalled it is prepared to hike [16][17][18]. Energy producers and gold miners carried the TSX, while banks and other rate-sensitive stocks weakened in September. Housing was flat nationally and soft in Toronto and Vancouver [19][20][21].
Major Stock Market Returns, Third Quarter Only to Date
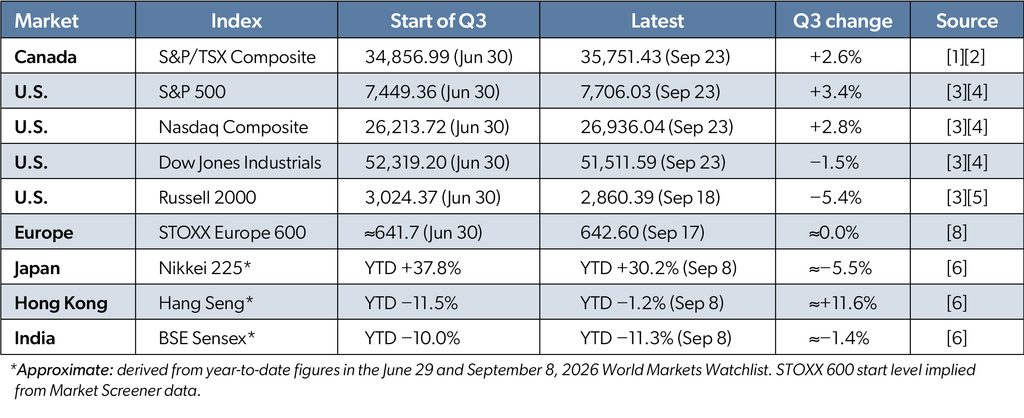
Regional highlights. U.S. semiconductors fell about 18% in July before tech rebounded in August on strong Q2 earnings; rising yields erased much of September’s gain [11][7][24]. Japan’s Nikkei fell almost 8% in July on AI selling but remains the top major market year-to-date. Emerging markets fell 3.0% in July (Korea −17.1%, Taiwan −5.3%, China +9.0%) and rose 3.4% in August [7]. Europe was flat despite 24% Q2 earnings growth, as energy costs and a hawkish ECB weighed [5].
Canada in Focus
The TSX rose 1.06% in July and 2.96% in August, reaching +14.4% year-to-date at August 31, before slipping in September; on September 23 it fell 1.6% to 35,751 as yields hit multi-year highs and bank shares dropped [9][10][1]. The index trades at 17.4 times forward earnings with 12% expected earnings growth [9]. The Canadian dollar was stable at about 70.9 U.S. cents [1][2].
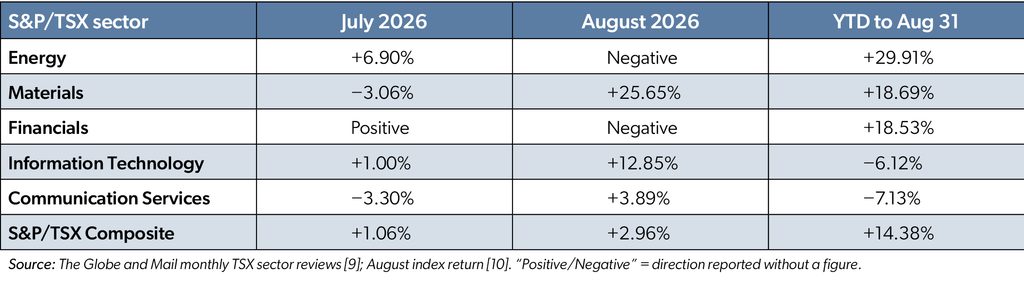
Key drivers. Gold and silver miners drove August (the top ten TSX gainers were all miners), but gave background in September as the U.S. dollar strengthened [9][1]. Energy benefited from Brent above US$100 and from the energy carve-out in the new U.S. tariffs [18]. Banks remain strong over 12 months but fell 2–3% on September 23 as markets priced Bank of Canada hikes [1]. Technology and telecoms remain the weakest sectors year-to-date despite an August rebound, including Shopify +24% in August [9].
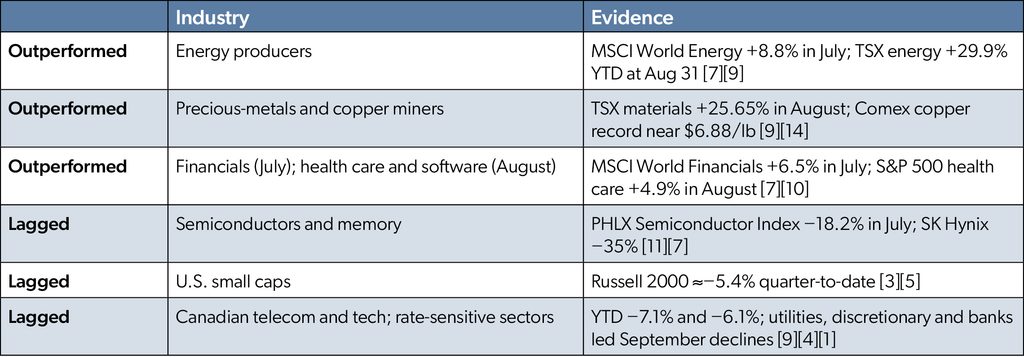
Industries That Outperformed and Lagged

National sales and prices were unchanged for a fourth straight month. CREA warned that higher fixed mortgage rates and priced-in Bank of Canada hikes are expected to dampen momentum into 2027 [19]. Toronto listings are falling faster than sales, which could eventually support prices, while Vancouver prices are down about 6% year-over-year [20][21].
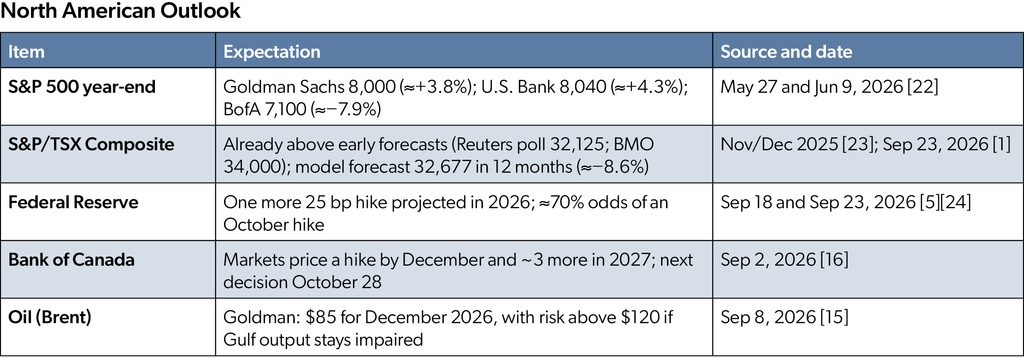
United States. Earnings remain the main support (Goldman expects 24% EPS growth in 2026), but a hiking Fed and 10-year yields above 5% limit multiple expansion [22][4]. The base case implied by most targets is low-to-mid single-digit upside into year-end; the downside case is further yield increases, oil-driven inflation, or another AI-trade unwind. The November 3 midterms add event risk.
Canada. The TSX’s heavy energy and materials weighting acts as a hedge while oil and metals stay high, and U.S. tariff carve-outs protect the largest exporters [18]. The main risks are Bank of Canada hikes hitting banks and rate-sensitive sectors, a reversal in gold, tariff-driven slowing after a flat July, and fuller valuations [9][16][17].
Our Team’s Position
Canadian bank stocks and U.S. tech stocks have increased significantly in under four years [25]. Retirees should consider taking ample profit for cash flow needs of any type into late 2027. Equity levels in portfolios are likely above what you approved on paper with us and dynamic rebalancing is likely also required to bring portfolios back into approved asset allocation levels.
We continue to be concerned about the Canadian economy mostly due to the new tariffs and countervailing tariffs that came into place in September 2026. Our stance is defensive in Canada as a result, while we are still offensive in U.S. equities mostly due to the future benefits of artificial intelligence continuing to lift corporate profits.
Bonds: A New Era for Fixed Income?
From the desk of Gerdi Lito, CFA
Portfolio Manager, Manulife Wealth Inc.
After several years of unusually low interest rates followed by rapid rate increases in 2022-2023, the bond market has entered a very different environment. Bonds now offer a meaningful level of income, but the outlook for interest rates is becoming less straightforward.
U.S. Bonds — Higher Yields, Higher Uncertainty
The U.S. bond market continues to be heavily influenced by the Federal Reserve and the strength of the American economy. In September, the Fed raised its target interest-rate range by 0.25% to 3.75%–4.00% [4], noting that economic activity remains solid but inflation is still elevated.
Longer-term U.S. government bond yields have also moved significantly higher. The 10-year Treasury yield was around 5.29% [25] at the end of September, while the 30-year yield was 5.64% [25]. These are levels not seen for many years.
Short-term yields are heavily influenced by the Federal Reserve (through rate cuts, rate increases and other mechanisms), while longer-term yields also reflect expectations for inflation, economic growth and the amount of government debt being issued.
The U.S. government continues to run large fiscal deficits, increasing the supply of Treasury bonds available to investors. At the same time, the U.S. economy has remained relatively resilient, which has reduced expectations for a rapid decline in longer-term rates. As a result, investors can now earn substantially more income from high-quality U.S. government bonds, but longer-term bonds can still experience significant price volatility.
Another important factor impacting the US bond market is the reduction of demand for US bonds from foreign investors. Less demand means lower bond prices (higher yields). This is related to increased worries about US government debt, but has also been seen as being influenced from the fact that there is now a larger quantity of debt issued to fund AI investments from major tech companies, which have attracted investors worldwide.
Higher yields can create short-term volatility for existing bond holdings, but they also mean that new investments in bonds can earn more income than they could during the ultra-low-rate period of the past decade.
Canadian Bonds — A Different Economic Picture
Canada is facing a somewhat different economic environment. The Bank of Canada has held its overnight rate at 2.25%, while inflation has remained around 3% [16] recently, partly reflecting higher gasoline prices. The Bank has also highlighted uncertainty surrounding tariffs and the Canadian economy.
Canadian government bond yields have risen as well. As of September 30, the 10-year Government of Canada yield was approximately 3.99%, while longer-term bonds were yielding about 4.30%. [25]
This is important because fixed mortgage rates and other borrowing costs are influenced more by government bond yields than by the Bank of Canada’s overnight rate. Canada’s relatively high household debt and sensitivity to housing and consumer spending also make the economy particularly responsive to interest rates. For bond investors, this creates a different opportunity from the U.S. market: Canadian bonds offer attractive income while also providing exposure to an economy where slower growth could eventually put downward pressure on interest rates.
What Does This Mean for your portfolio?
The important point is that bonds are once again able to play both roles in a portfolio:
- providing income,
- helping diversify stocks, especially during recessions.
The bond market is no longer simply a place to protect capital while earning very little interest. Today’s higher yields provide a more meaningful source of portfolio income. This is especially important for retirees living of income from their portfolios.
Different types of bonds carry different risks. Shorter-term bonds generally have less sensitivity to changes in interest rates, while longer-term bonds can experience larger price movements. Credit quality also matters, particularly when moving beyond government bonds.
Disclosure
Upper Canada Capital is a trade name used to carry on business related to life insurance and stocks, bonds and mutual funds. Investment dealer dealing representatives (“Investment advisors”) registered with Manulife Wealth Inc. offer stocks, bonds and mutual funds. Insurance products and services are offered through Upper Canada Capital Inc. and Manulife Wealth Insurance Services Inc. Banking products and services are offered by referral arrangements through our related company Manulife Bank of Canada. Additional disclosure information will be provided upon referral. Please confirm with your Advisor which company you are dealing with for each of your products and services.
Manulife, Manulife & Stylized M Design, Stylized M Design and Manulife Wealth are trademarks of The Manufacturers Life Insurance Company and are used by it, and by its affiliates under license. This is not an official publication of Manulife Wealth. The views, opinions and recommendations contained in this publication are those solely of the author and this publication does not express the views, opinions or recommendations of Manulife Wealth.
This publication is not an offer to sell, or a solicitation of an offer to buy, any securities. This publication is not meant to provide legal, accounting, account or other advice. As each situation is different, you should seek advice based on your specific circumstances. Please call to arrange for an appointment. Manulife Wealth makes no representation or warranty, express or implied, as to the accuracy, completeness or correctness of the information contained in this publication.
The Advisor and Manulife Wealth and Manulife Wealth Insurance Services Inc. (“Manulife Wealth”) do not make any representation that the information in any linked site and/or 3rd party articles is accurate and will not accept any responsibility or liability for any inaccuracies in the information not maintained by them, such as 3rd party articles and/or linked sites. Any opinion or advice expressed in a 3rd party article and/or linked site should not be construed as the opinion or advice of the advisor or Manulife Wealth. The information in this communication is subject to change without notice.
The preceding information is for educational purposes only. As it is impossible to include all situations, circumstances and exceptions in a newsletter such as this, a further review should be done by a qualified professional. No individual or organization involved in either the preparation or distribution of this letter accepts any contractual, tortious, or any other form of liability for its contents.